Compute Pairwise Gene Co-expression Correlation Matrix
Source:R/stats_tests.R
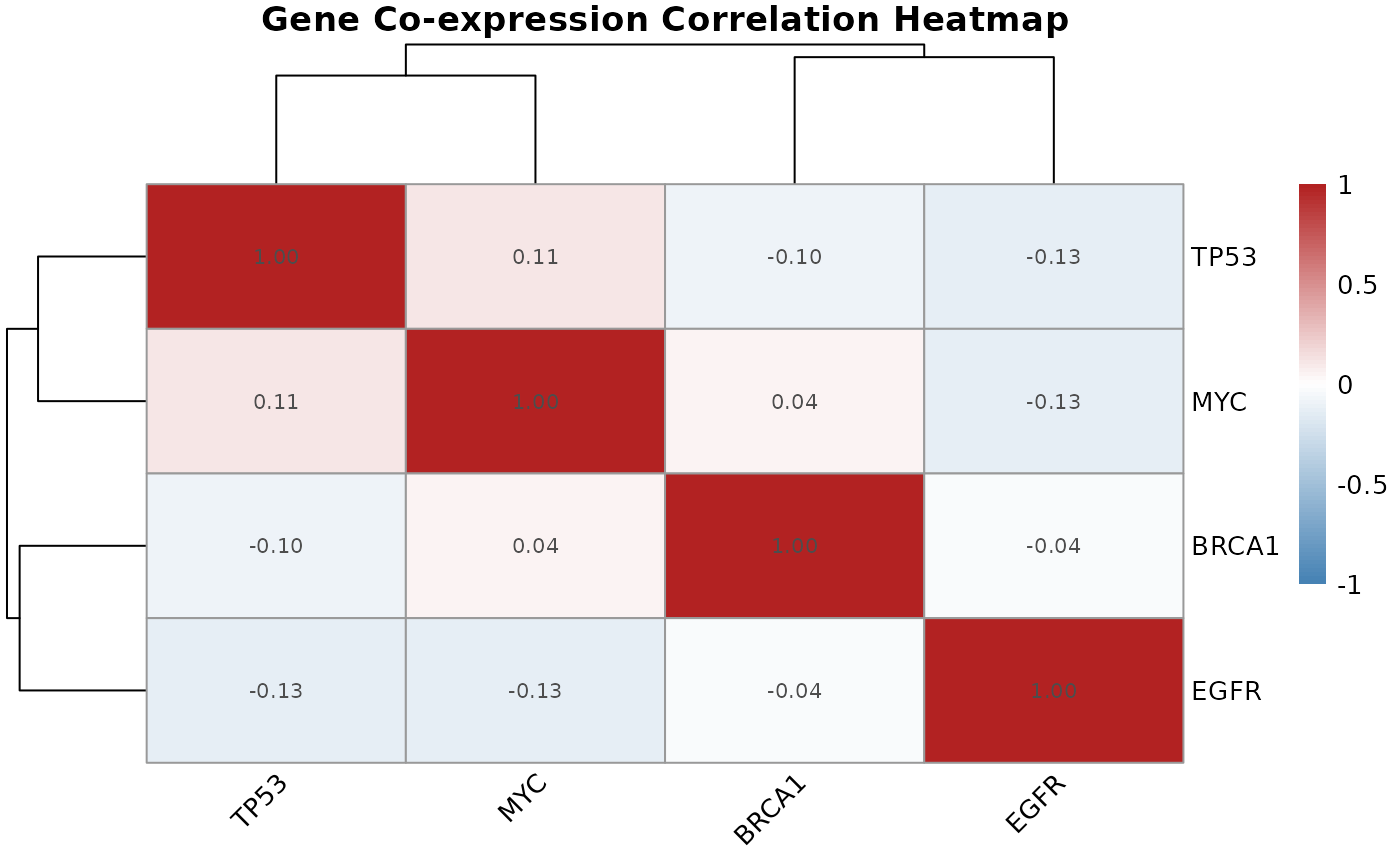
gene.correlation.matrix.RdCalculates pairwise correlations between a set of genes across all samples, producing a symmetric correlation matrix that quantifies co-expression relationships.
Arguments
- expression.matrix
Numeric matrix of gene expression values as returned by
extract.expression()$expression. Rows are probes, columns are samples.- probe.ids
Integer vector of probe IDs to include, as returned by
find.probe.by.gene().- method
Character. Correlation method:
"pearson"(default),"spearman", or"kendall". Spearman is recommended when distributions are skewed or outliers are a concern.
Value
A symmetric numeric matrix of dimensions length(probe.ids) x
length(probe.ids), where each cell contains the pairwise correlation
coefficient across all samples. Diagonal values are 1. Row and column
names correspond to probe IDs.
Details
Co-expression correlations capture whether two genes tend to be
simultaneously up- or down-regulated across samples, which can suggest
shared regulatory control or pathway membership. The resulting matrix is
the direct input for plot.correlation.heatmap().