Plot Gene Expression with Automatic Statistical Analysis
Source:R/visualization.R
gene.analysis.plot.RdGenerates an annotated visualization of gene expression between two groups.
For a single-gene data frame, the plot is annotated with statistical results
from analyze.gene(). For a multi-gene data frame, the plot is
faceted by gene and annotations are omitted, use analyze.gene() on
each gene subset for per-gene statistics.
Arguments
- df
A data frame as produced by
build.analysis.df(), containing:- expression
Numeric vector of gene expression values.
- group
Character or factor vector with exactly two group labels.
- gene
Character vector of gene names. Optional; when present and containing more than one unique value, enables faceted multi-gene plotting.
- alpha
Numeric. Significance level passed to
analyze.gene(). Default is0.05. Only used in single-gene mode.- n.boot
Integer. Number of bootstrap resamples for the confidence interval, passed to
analyze.gene(). Default is1000. Only used in single-gene mode.- show.points
Logical. Whether to overlay jittered individual sample points on the violin/boxplot. Default is
TRUE.
Value
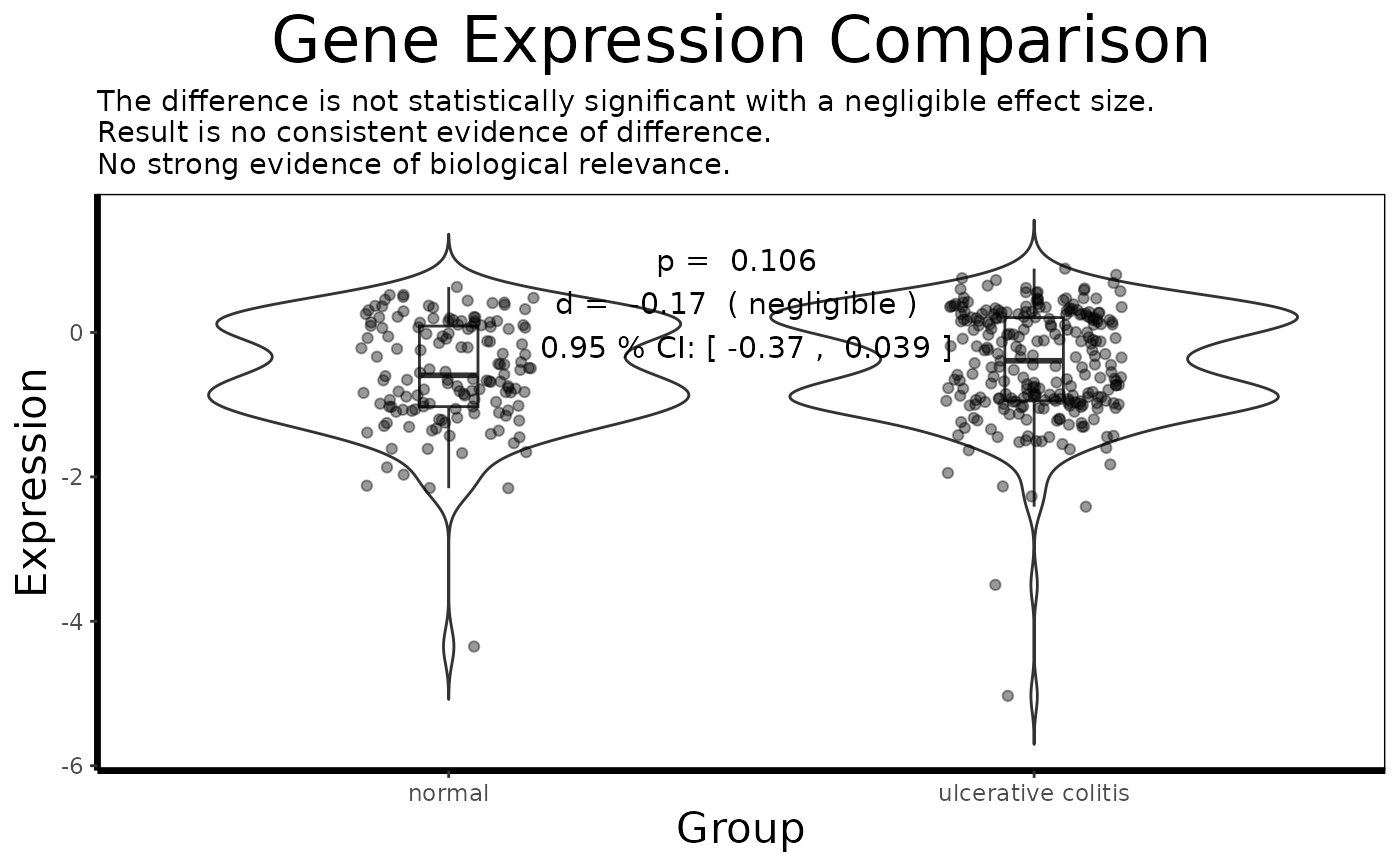
A ggplot object. In single-gene mode the plot includes a
text annotation with p-value, Cohen's d, and bootstrapped CI, and a
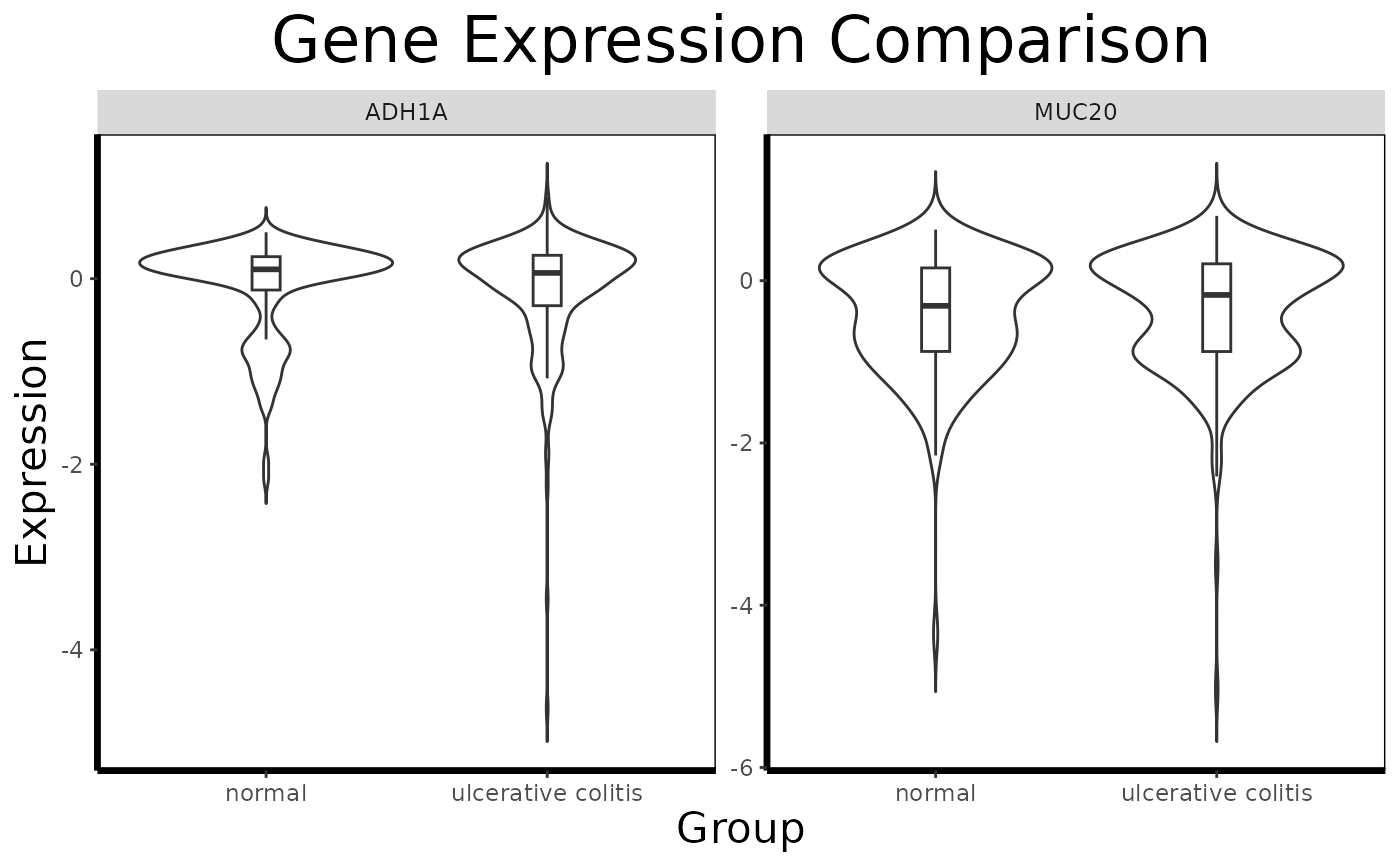
subtitle with the full interpretation string. In multi-gene mode the
plot is faceted by gene with no statistical annotation.
Details
Single-gene mode is triggered when the gene column is absent or
contains exactly one unique value. Multi-gene mode is triggered when
gene contains more than one unique value, producing a
facet_wrap(~ gene) layout. The plot theme is consistent across
both modes and matches the style conventions of the BioUtils package.
Examples
# \donttest{
geo <- extract.expression(load.geo.soft(accession = "GDS3268", log.transform = TRUE))
#> GDS3268 not found locally, downloading from NCBI GEO...
#> Using locally cached version of GDS3268 found here:
#> /tmp/RtmpxRZSjV/GDS3268.soft.gz
#> Warning: NaNs produced
#> Using locally cached version of GPL1708 found here:
#> /tmp/RtmpxRZSjV/GPL1708.annot.gz
# Single-gene plot with statistical annotation
probe <- find.probe.by.gene(geo$gene, "mucin 20, cell surface associated")
expr <- get.gene.expression(geo$expression, probe)
df <- build.analysis.df(expr, geo$phenotype, geo$gene)
gene.analysis.plot(df)
 # Multi-gene faceted plot
probes <- find.probe.by.gene(geo$gene, c(
"mucin 20, cell surface associated",
"alcohol dehydrogenase 1A (class I), alpha polypeptide"
))
expr.multi <- get.gene.expression(geo$expression, probes)
df.multi <- build.analysis.df(expr.multi, geo$phenotype, geo$gene)
gene.analysis.plot(df.multi)
# Multi-gene faceted plot
probes <- find.probe.by.gene(geo$gene, c(
"mucin 20, cell surface associated",
"alcohol dehydrogenase 1A (class I), alpha polypeptide"
))
expr.multi <- get.gene.expression(geo$expression, probes)
df.multi <- build.analysis.df(expr.multi, geo$phenotype, geo$gene)
gene.analysis.plot(df.multi)
 # }
# }